|
|
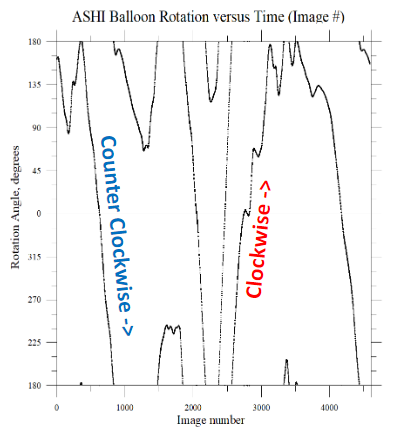
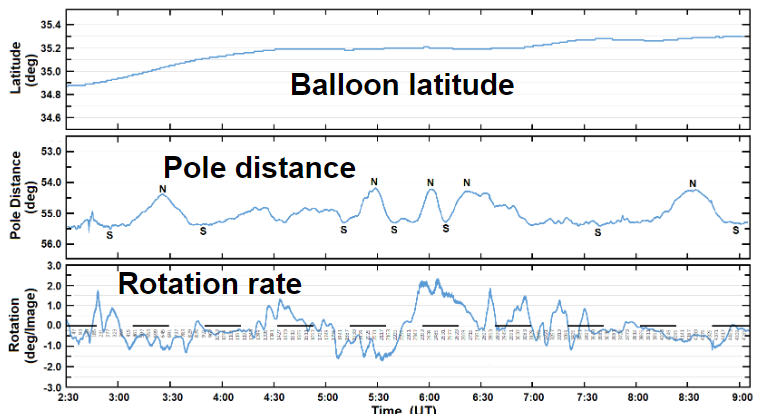
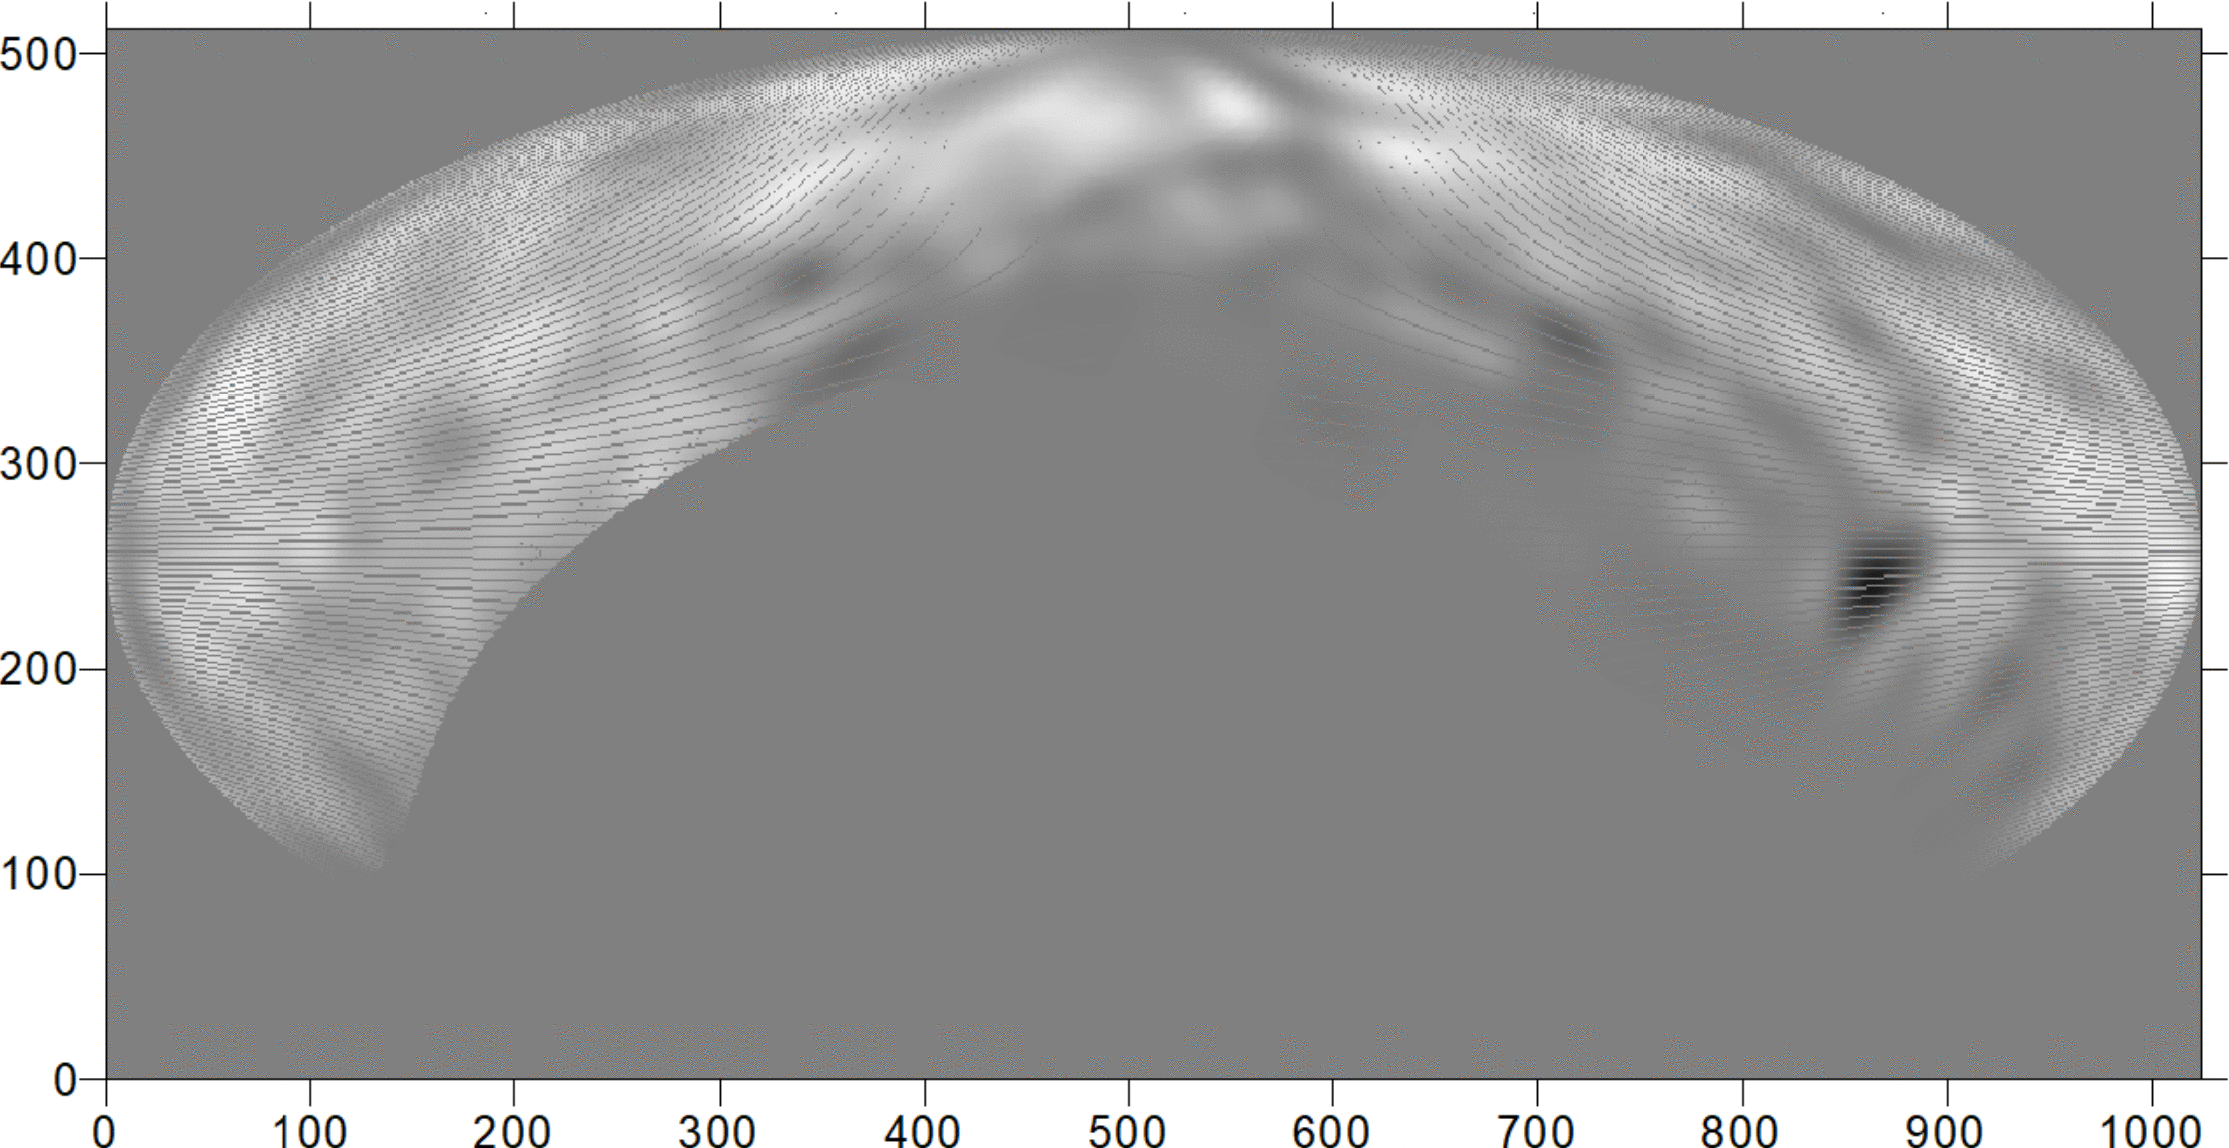
Before any accurate numerical data can be retrieved ASHI must undergo a series of corrections due to the physical qualities of the lens and camera. (Left) The balloon rotated throughout the 6 ½ hour imaging duration sometimes counterclockwise as viewing the stars, sometimes clockwise. This needed to be removed from the ASHI images. This was accomplished by viewing Polaris, and using it to provide the pole position.(Top Right)The balloon latitude changed by about a degree during the flight. (Middle Right)Due to rotation the image center distance to the pole changed throughout the flight by about one degree (a wobble of a half degree). (Bottom Right)The rotation rate of the balloon is given in degrees per 4 second image, and at the outer edge of the hemisphere this can provide an elongation of the stellar point spread function. This plot shows the location of the regions to avoid from this effect, if necessary.
|
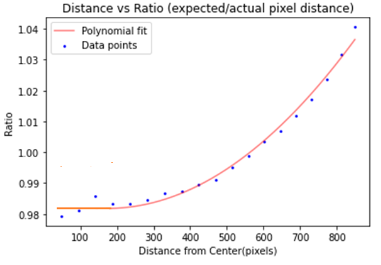
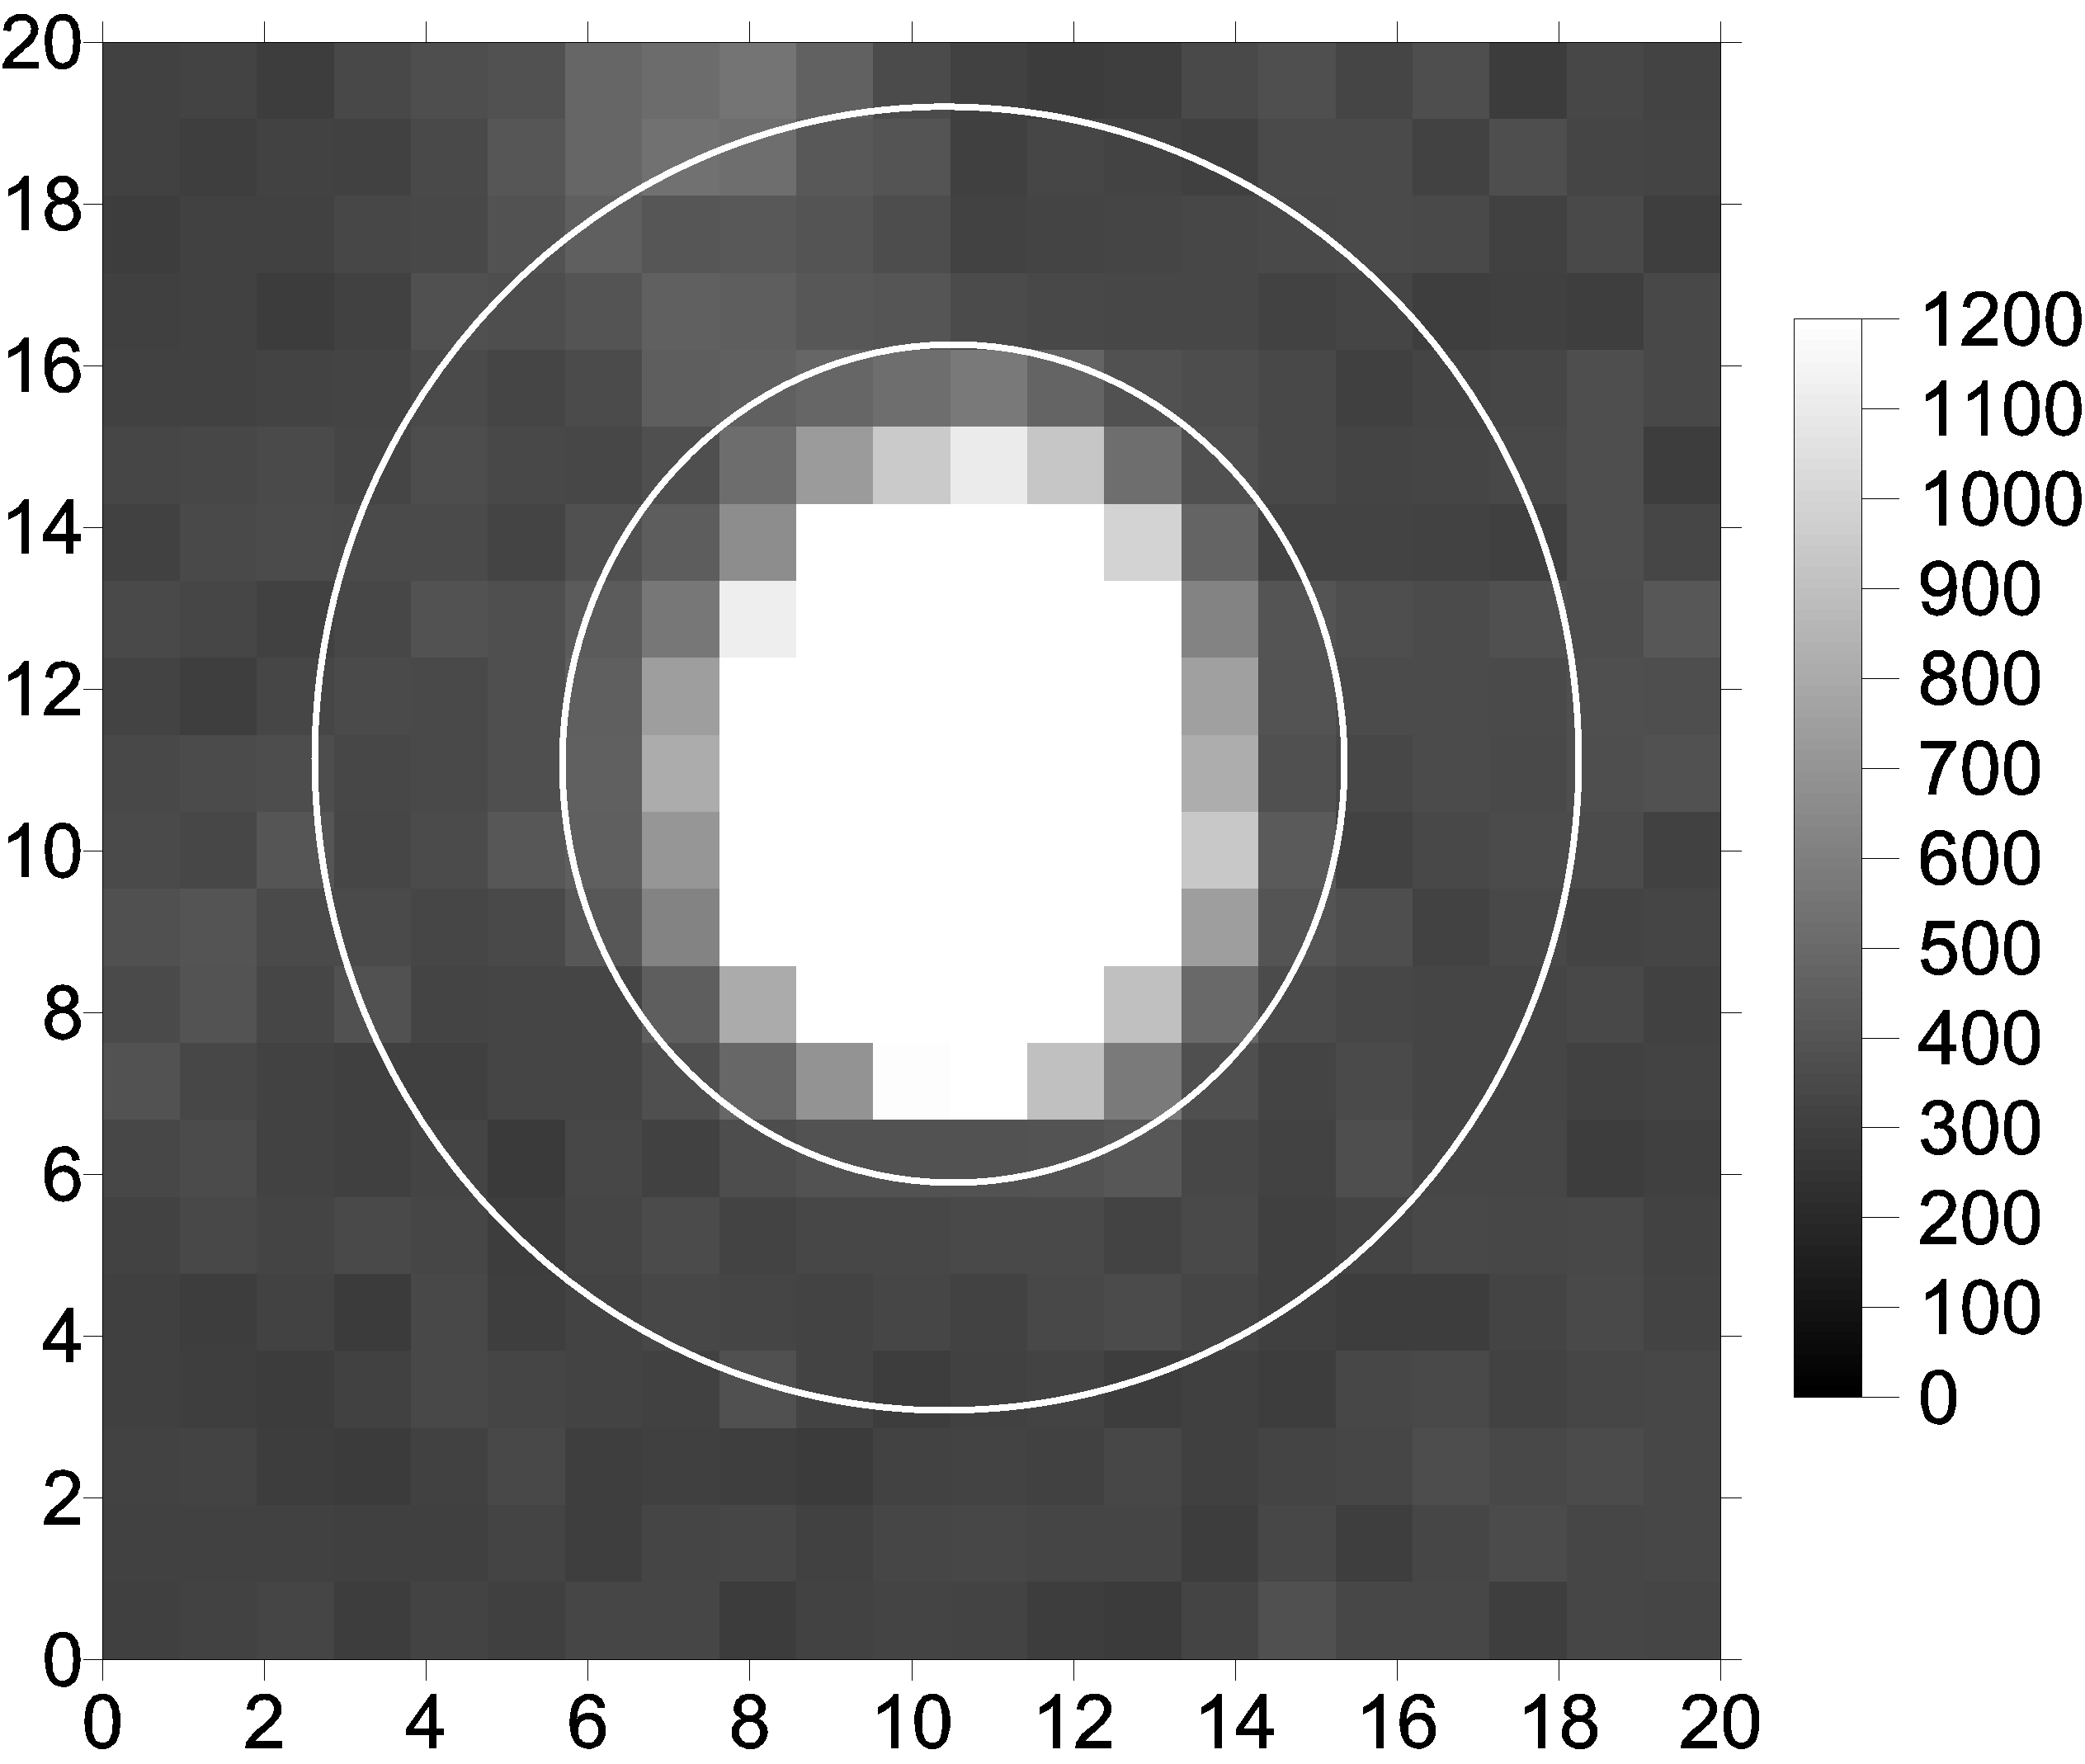
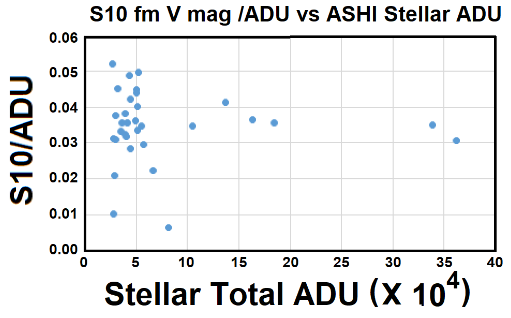
ASHI's fisheye lens must be de-trended to remove the center to edge distortion. The graph (left) shows the non-linearity present and is stretched or contracted in respect to the 1:1 point at approximately 54 degrees in the field of view. (Right) A singular star is shown and from this, and the use of other stars, the throughput of our optics can be examined. An annulus is placed around the star and the outer annulus contains the background. The background can be averaged and removed from the brightness of the star to give an accurate measurement of ADUs which represent the total brightness from this particular star. This is done for many stars and then put on a scale of S10s/ADUs, and S10 being the brightness of a 10th magnitude star in a square degree of sky and ADUs being analog-to-digital units. The throughput derived can be seen below.
|
(Left) From the calculations from each stars brightness, and conversion into S10 units our throughput yields about 0.035 S10/ADUs. This means we can effectively see variations of brightness on the order of 0.05 S10 units or somewhat below 15 orders of magnitude below the brightness of the Sun. To adequately provide this level much more than a single image must be used to amplify the signal compared to the noise. For our balloon flight analysis, we have split up series of images into hour and a half increments and created 3 equal area maps that has removed sidereal time effects and has placed stellar signals in a sky map at the same locations. (Right) A difference of these images can remove the brightness from the stars and reveal a threshold at the level of the heliosphere. Three difference images are looped in this video to show the change at this level during our balloon flight.